©2002-2017 Ulm University, Othmar Marti, 
[Vorherige
Seite] [vorheriges Seitenende] [Seitenende] [Ebene nach oben]
[PDF-Datei][Epub-Datei][Andere Skripte]
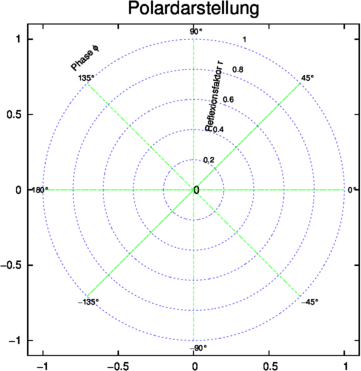
G.7 Polar-Plots
mit Gnuplot 4.2
Um einen Polar-Plot mit Gnuplot 4.2 herzustellen, braucht man
zwei Dateien. Die erste, polargrid.plt dient als Steuerdatei,
während die zweite, polarloop.plt die einzelnen Kurven
zeichnet.
Der Inhalt der ersten Datei („polargrid.plt“) ist:
reset;
set encoding iso_8859_1
cd ’Ihr Verzeichnis’;
set terminal win;
complex(x,y) = x*{1,0}+y*{0,1}
conformal(z) = (z-1)/(z+1)
pi = 4*atan(1)
lblIMRE(x) = 1.05*real(conformal(complex(0,x)))-0.025
lblIMIM(x) = 1.05*imag(conformal(complex(0,x)))
lblRERE(x) = real(conformal(complex(x,0)))+0.005
set nokey
set size square
set parametric
unset xlabel
unset ylabel
set title "Polardarstellung" font "Arial,24"
unset logscale x
unset logscale y
set xrange[-1.1:1.1]
set yrange[-1.1:1.1]
set samples 1500
set label 1 "0°" at 1.05*cos(0*pi)-0.025,1.05*sin(0*pi) font "Arial,10"
set label 2 "45°" at 1.05*cos(0.25*pi)-0.025,1.05*sin(0.25*pi) font "Arial,10"
set label 3 "90°" at 1.05*cos(0.5*pi)-0.025,1.05*sin(0.5*pi) font "Arial,10"
set label 4 "135°" at 1.05*cos(0.75*pi)-0.025,1.05*sin(0.75*pi) font "Arial,10"
set label 5 "180°" at 1.05*cos(1*pi)-0.025,1.05*sin(1*pi) font "Arial,10"
set label 6 "-135°" at 1.05*cos(1.25*pi)-0.025,1.05*sin(1.25*pi) font "Arial,10"
set label 7 "-90°" at 1.05*cos(1.5*pi)-0.025,1.05*sin(1.5*pi) font "Arial,10"
set label 8 "-45°" at 1.05*cos(1.75*pi)-0.025,1.05*sin(1.75*pi) font "Arial,10"
set label 10 "0" at 1.05*0*cos(0.4*pi),1.05*0*sin(0.4*pi) font "Arial 10"
set label 11 "0.2" at 1.05*0.2*cos(0.4*pi),1.05*0.2*sin(0.4*pi) font "Arial,10"
set label 12 "0.4" at 1.05*0.4*cos(0.4*pi),1.05*0.4*sin(0.4*pi) font "Arial,10"
set label 13 "0.6" at 1.05*0.6*cos(0.4*pi),1.05*0.6*sin(0.4*pi) font "Arial,10"
set label 14 "0.8" at 1.05*0.8*cos(0.4*pi),1.05*0.8*sin(0.4*pi) font "Arial,10"
set label 15 "1" at 1.05*1*cos(0.4*pi),1.05*1*sin(0.4*pi) font "Arial,10"
set label 3000 "Phase {/Symbol=12 f}" at -0.8,0.8 rotate by 45 font "Arial,12"
set label 3001 "Reflexionsfaktor r" at 0.4*cos(0.42*pi),0.4*sin(0.42*pi) font "Arial,12" rotate by 0.45*180
a=-1
set multiplot
load ’polarloop.plt’
unset multiplot
unset parametric
Die Schleifendatei („polarloop.plt“) lautet
a = a+1
set trange [-pi:pi]
plot a*0.2*cos(t),a*0.2*sin(t) lt 5
set trange [-1:1]
plot t*cos(a*pi/4),t*sin(a*pi/4) lt 4
if(a<5) reread
Abbildung G.3 zeigt das Resultat, wenn smithgrid.plt mit
Gnuplot 4.2 verarbeitet wird.
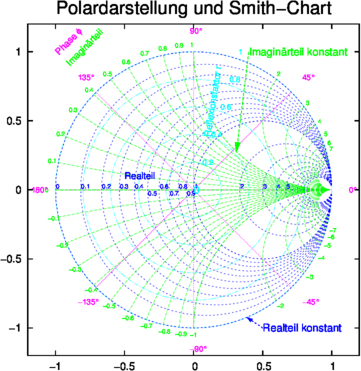
Die beiden Darstellungen können verknüpft werden, wie in
Abbildung G.4 gezeigt wird.
[Vorherige Seite] [vorheriges Seitenende] [Seitenanfang]
[Ebene nach oben]
©2002-2017 Ulm University, Othmar
Marti,  Lizenzinformationen