©2002-2017 Ulm University, Othmar Marti, 
[Vorherige
Seite] [vorheriges Seitenende] [Seitenende] [Ebene nach
oben] [PDF-Datei][Epub-Datei][Andere Skripte]
G.6 Daten
auf Smith-Charts zeichnen mit Gnuplot 4.2
Die folgende Anweisung ist eine Erweiterung des
Gnu-Plot-Verfahrens durch Helmut Sennewald (helmutsennewald
(at) t-online.de). Neben der Schleifendatei („smithloop.plt
“) verwenden wir eine Datei „smithgrid-n.plt“ um den
Smith-Chart zu zeichnen und die Datei „smith_plot_data.plt“
um die Datendatei „data1.txt“ zu zeichnen.
Die Datei „smithgrid-n.plt“ ist eine modifizierte Version der
Datei „smithgrid.plt“ aus dem vorherigen Abschnitt.
lblIMRE(x) = 1.05*real(conformal(complex(0,x)))-0.025
lblIMIM(x) = 1.05*imag(conformal(complex(0,x)))
lblRERE(x) = real(conformal(complex(x,0)))+0.005
unset key
set size square
set parametric
unset xlabel
unset ylabel
set title "Smith-Chart" font "Arial,24"
unset logscale x
unset logscale y
set xrange[-1.1:1.1]
set yrange[-1.1:1.1]
set samples 1500
set label 1 "0" at lblIMRE(0),lblIMIM(0) font "Arial,8"
set label 2 "0.1" at lblIMRE(0.1),lblIMIM(0.1) font "Arial,8"
set label 3 "0.2" at lblIMRE(0.2),lblIMIM(0.2) font "Arial,8"
set label 4 "0.3" at lblIMRE(0.3),lblIMIM(0.3) font "Arial,8"
set label 5 "0.4" at lblIMRE(0.4),lblIMIM(0.4) font "Arial,8"
set label 6 "0.5" at lblIMRE(0.5),lblIMIM(0.5) font "Arial,8"
set label 7 "0.6" at lblIMRE(0.6),lblIMIM(0.6) font "Arial,8"
set label 8 "0.7" at lblIMRE(0.7),lblIMIM(0.7) font "Arial,8"
set label 9 "0.8" at lblIMRE(0.8),lblIMIM(0.8) font "Arial,8"
set label 10 "0.9" at lblIMRE(0.9),lblIMIM(0.9) font "Arial,8"
set label 20 "1" at lblIMRE(1),lblIMIM(1) font "Arial,8"
set label 21 "2" at lblIMRE(2),lblIMIM(2) font "Arial,8"
set label 22 "3" at lblIMRE(3),lblIMIM(3) font "Arial,8"
set label 23 "4" at lblIMRE(4),lblIMIM(4) font "Arial,8"
set label 24 "5" at lblIMRE(5),lblIMIM(5) font "Arial,8"
set label 25 "6" at lblIMRE(6),lblIMIM(6) font "Arial,8"
set label 26 "7" at lblIMRE(7),lblIMIM(7) font "Arial,8"
set label 102 "-0.1" at lblIMRE(-0.1),lblIMIM(-0.1) font "Arial,8"
set label 103 "-0.2" at lblIMRE(-0.2),lblIMIM(-0.2) font "Arial,8"
set label 104 "-0.3" at lblIMRE(-0.3),lblIMIM(-0.3) font "Arial,8"
set label 105 "-0.4" at lblIMRE(-0.4),lblIMIM(-0.4) font "Arial,8"
set label 106 "-0.5" at lblIMRE(-0.5),lblIMIM(-0.5) font "Arial,8"
set label 107 "-0.6" at lblIMRE(-0.6),lblIMIM(-0.6) font "Arial,8"
set label 108 "-0.7" at lblIMRE(-0.7),lblIMIM(-0.7) font "Arial,8"
set label 109 "-0.8" at lblIMRE(-0.8),lblIMIM(-0.8) font "Arial,8"
set label 1010 "-0.9" at lblIMRE(-0.9),lblIMIM(-0.9) font "Arial,8"
set label 1020 "-1" at lblIMRE(-1),lblIMIM(-1) font "Arial,8"
set label 1021 "-2" at lblIMRE(-2),lblIMIM(-2) font "Arial,8"
set label 1022 "-3" at lblIMRE(-3),lblIMIM(-3) font "Arial,8"
set label 1023 "-4" at lblIMRE(-4),lblIMIM(-4) font "Arial,8"
set label 1024 "-5" at lblIMRE(-5),lblIMIM(-5) font "Arial,8"
set label 1025 "-6" at lblIMRE(-6),lblIMIM(-6) font "Arial,8"
set label 1026 "-7" at lblIMRE(-7),lblIMIM(-7) font "Arial,8"
set label 2000 "0" at lblRERE(0),0.025 font "Arial,8"
set label 2001 "0.1" at lblRERE(0.1),0.025 font "Arial,8"
set label 2002 "0.2" at lblRERE(0.2),0.025 font "Arial,8"
set label 2003 "0.3" at lblRERE(0.3),0.025 font "Arial,8"
set label 2004 "0.4" at lblRERE(0.4),0.025 font "Arial,8"
set label 2005 "0.5" at lblRERE(0.5),0.025 font "Arial,8"
set label 2006 "0.6" at lblRERE(0.6),0.025 font "Arial,8"
set label 2007 "0.7" at lblRERE(0.7),-0.025 font "Arial,8"
set label 2008 "0.8" at lblRERE(0.8),0.025 font "Arial,8"
set label 2009 "0.9" at lblRERE(0.9),-0.025 font "Arial,8"
set label 2010 "1" at lblRERE(1),0.025 font "Arial,8"
set label 2011 "2" at lblRERE(2),0.025 font "Arial,8"
set label 2012 "3" at lblRERE(3),0.025 font "Arial,8"
set label 2013 "4" at lblRERE(4),0.025 font "Arial,8"
set label 2014 "5" at lblRERE(5),0.025 font "Arial,8"
set label 3000 "Imag" at -1,0.6 rotate by 45 font "Arial,12"
set label 3001 "Real" at -0.5,0.1 font "Arial,12"
set label 30 "inf" at 1.01,0
a=-1
set multiplot
load ’smithloop.plt’
Die aufzurufende Datei ist „smith_plot_data.plt“:
reset;
set encoding iso_8859_1
set terminal win;
complex(x,y) = x*{1,0}+y*{0,1}
conformal(z) = (z-1)/(z+1)
pi = 4*atan(1)
#this portion is by Helmut Sennewald (helmutsennewald (at) t-online.de)
load "smithgrid-n.plt"
set style data linespoints
pause 1
plot ’data1.txt’ \
using (real(conformal(complex($1,$2)))):\
(imag(conformal(complex($1,$2)))) \
linewidth 2
unset multiplot
unset parametric
pause -1 "Hit return to continue, jetzt auf smith-26.eps"
set output "smith-26.eps"
set terminal postscript eps enhanced color
set parametric
a=-1
load "smithgrid-n.plt"
set style data linespoints
pause 1
plot ’data1.txt’ \
using (real(conformal(complex($1,$2)))):\
(imag(conformal(complex($1,$2)))) \
linewidth 2
unset multiplot
unset parametric
pause -1 "Gespeichert"
set output
set terminal windows
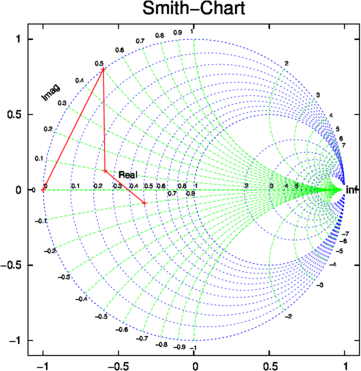
Die Datendatei „data1.txt“ hat schliesslich den Inhalt
0, 0
0, 0.5
0.25, 0.1
0.5, -0.1
Abbildung G.2 zeigt das Resultat, wenn smith_plot_dta.plt
mit Gnuplot 4.2 verarbeitet wird.
[Vorherige Seite] [vorheriges Seitenende] [Seitenanfang]
[Ebene nach oben]
©2002-2017 Ulm University, Othmar
Marti,  Lizenzinformationen